
Today it is very common to use Docker to deploy applications of all kinds, since this technology offers many advantages, such as great flexibility to achieve reduced consumption of resources.
A well-sized Docker container allows the hosted application to provide optimal service without wasting resources due to unnecessary oversizing.
Some time ago I optimized the memory consumption of a dockerized Java/Spring Boot application. If you want to know how I did it, keep reading!
Initial Docker Container
We can deploy containers with Java applications from a Docker image with an implementation of the Java Platform. I chose an image from OpenJDK, an open source implementation of the Java Platform (Standard Edition). Specifically, I chose 8-jdk-alpine, as it is very small in size because it is based on Alpine Linux.
Then, I created a Dockerfile so that I could build the final image with the Spring Boot application included.
FROM openjdk:8-jdk-alpine
RUN addgroup -S spring && adduser -S spring -G spring
USER spring:spring
ARG JAR_FILE=/build/*.jar
ADD ${JAR_FILE} app.jar
ENV JAVA_OPTS=''
ENTRYPOINT java $JAVA_OPTS -jar /app.jarAs we can see, the Dockerfile is simple. I just applied changes to the base image to include the Spring Boot application .jar file and set its execution as the entrypoint.
In addition, with the JAVA_OPTS environment variable we allow that, when creating a container, it is possible to optionally set flags on the Java Virtual Machine (JVM) to limit resources consumption or enable other functions.
From the previous image, we can run containers in different ways. For this example, we define the creation of our container using Docker Compose:
version: '2.2'

services:

  springboot_app:
    container_name: 'springboot_app'
    image: 'springboot_app:1.0'
    ports:
      - '8080:8080'
    restart: always
By default and by setting no restrictions, Docker will run the container allowing it to consume as much memory as the host’s Kernel scheduler allows. On Linux systems, if the Kernel detects insufficient memory to perform important tasks, an OOME (Out Of Memory Exception) will be thrown and it will begin to kill processes to free up space.
By setting a limit on the memory consumption of the containers, we will have more control over memory and, at the same time, we will avoid infrastructure cost overruns.
Using docker stats command, we can check the memory limit assigned to the running containers:
$ docker stats --format "table {{.Name}}\t{{.MemUsage}}"
NAME                 MEM USAGE / LIMIT
springboot_app       246.1MiB / 4.833GiB
I use Docker Desktop to run Docker on my MacBook Pro. As I haven’t set any restrictions, the memory limit coincides with the maximum memory available for Docker Desktop, which in my case is 5Gb.
Now, how do we know how much memory is actually needed for the container?
Since our container runs a Java process, a first approach is to understand how memory consumption is managed in this kind of processes.
Memory of a Java process
The total memory that a Java process takes can be divided into two main blocks: Heap Memory and Non-Heap Memory.
Heap Memory
Heap Memory is dedicated to Java objects. This is initialized at JVM startup and its size is variable during application execution.
The Garbage Collector (GC) cleans up objects no longer in use when this memory becomes full, freeing up space for new ones.
If no limit is set for Heap Memory, it will be set automatically. Automatic memory allocation is done taking into account the system available physical memory, among other configuration aspects, in addition to the version of the Java Platform. This limit can be set with the -Xmx flag.
To check which is the Heap Memory limit in our container, we open a shell session inside the container:
docker exec -it springboot_app /bin/shNext we execute the following command, which returns the total Heap Memory limit in bytes:
$ java -XX:+PrintFlagsFinal -version | grep -iE 'MaxHeapSize'
uintx MaxHeapSize := 1298137088 {product}
The command java -XX:+PrintFlagsFinal -version allows to obtain the value of the different JVM flags. To filter the specific flag we are looking for, we use grep.
As we can see, the Heap Memory limit set in our container is about 1.3GB.
Non-Heap Memory
The memory consumed by a Java process is not only associated with Heap Memory. The JVM includes necessary components that also requires memory. The memory allocated for these components is independent of Heap Memory and is known as Non-Heap Memory.
Within Non-Heap Memory we find: Garbage Collector, Class Metaspace, JIT compiler, Code Cache, threads, etc. Some flags are available to limit the memory consumption of some of these components, but not all have this option.
With many factors to consider and some beyond our reach, there is no direct way to calculate the total size that Non-Heap Memory occupies. However, there are tools that help to monitor this memory block.
Monitoring the non-optimized Java process
To optimize the memory consumption of the Java process, I first monitored the process without applying any memory limitation. In this way, I was able to see how much the total Heap Memory consumed at runtime increased, as well as the Non-Heap Memory consumption.
My goal was that, based on this information, I could size the memory allocated to the process according to the real needs.
To monitor a Java process there are different options. From command line utilities like jcmd to visual tools like JConsole. In this example I will use JConsole in order to show graphs.
Java Management Extensions (JMX) need to be activated in order to use JConsole. To do this, it is necessary to set certain options in JAVA_OPTS within the definition of the container:
version: '2.2'

services:

  springboot_app:
    container_name: 'springboot_app'
    image: 'springboot_app:1.0'
    environment:
      JAVA_OPTS: '-Dcom.sun.management.jmxremote
                  -Dcom.sun.management.jmxremote.local.only=false
                  -Dcom.sun.management.jmxremote.authenticate=false
                  -Dcom.sun.management.jmxremote.port=9010
                  -Dcom.sun.management.jmxremote.rmi.port=9010
                  -Djava.rmi.server.hostname=0.0.0.0
                  -Dcom.sun.management.jmxremote.ssl=false'
    ports:
      - '8080:8080'
      - '9010:9010'
    restart: always
From this configuration, a container accessible from JConsole through 9010 port can be created.
With the following command we access JConsole:
$ jconsoleNext, a window like this should appear:
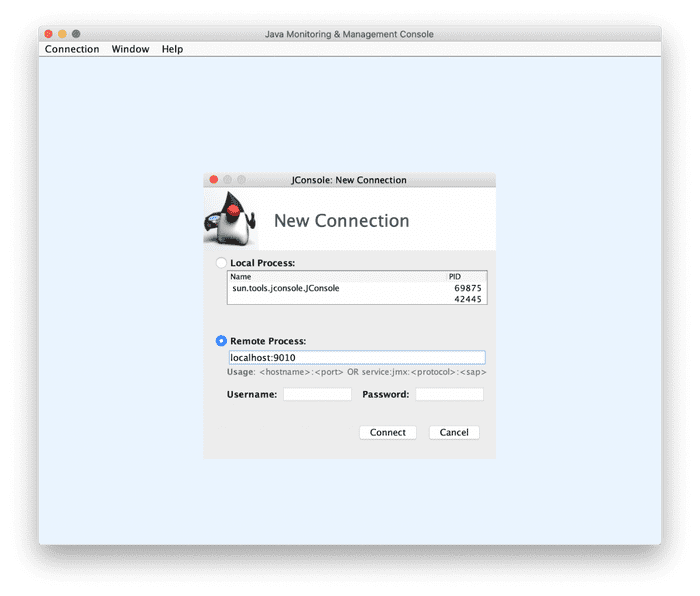
To establish a connection with the container we select Remote Access option and next we type the host and assigned port for monitoring.
I have disabled authentication for this example, so we can leave the user and password fields blank. I have also disabled SSL access, so a pop-up window may appear to confirm the connection.
Once connected, we can access Memory section:
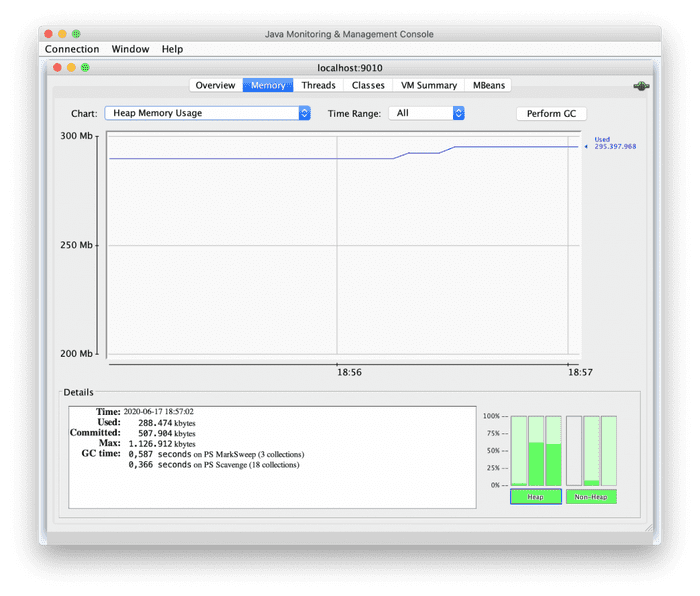
In this section we visualize graphs related to the consumption of Heap Memory and Non-Heap Memory. We can also view specific graphs for certain components (Code Cache, Metaspace, etc).
If we look at the Heap Memory graph, we see that it remains at around 295Mb. This is because the initial Heap Memory of the process is set by default to 25% of the maximum available (1.2Gb).
To visualize the consumption of Non-Heap Memory, we choose the corresponding graph:
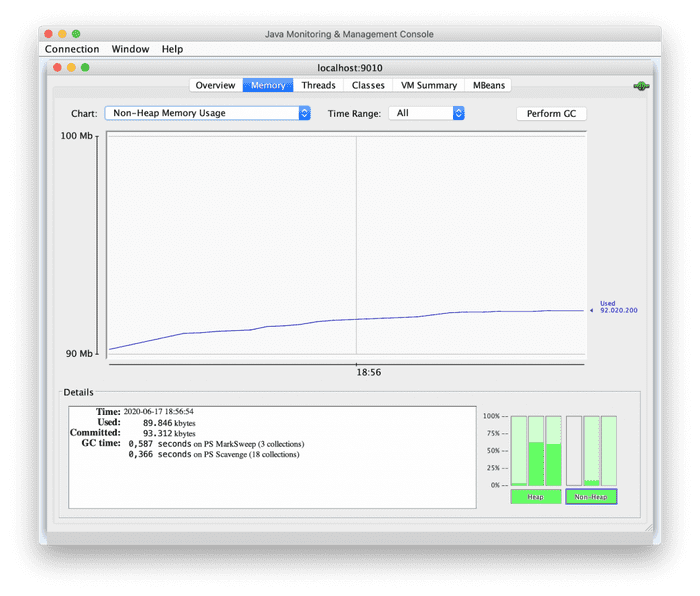
As we can see, the use of Non-Heap Memory increases to stabilize around 92Mb.
Being able to have a graph that shows the Non-Heap Memory consumption is very useful since, as I mentioned before, calculating the total consumption of this memory block is not easy.
Getting the maximum values of the two graphs and summing them would not be a correct approach to get the total memory required for the process, as these graphs correspond to memory consumption when the Spring Boot application is mostly idle.
To replicate a real application use scenario, we are going to define a load test.
It is important for the load test to be based on a correct forecast of the traffic that we expect the application to have in production. In this way we can monitor the memory consumption of the Java process in a realistic scenario. For this example, we will assume that 100 users making recurring requests to the application at the same time replicate the expected traffic in production.
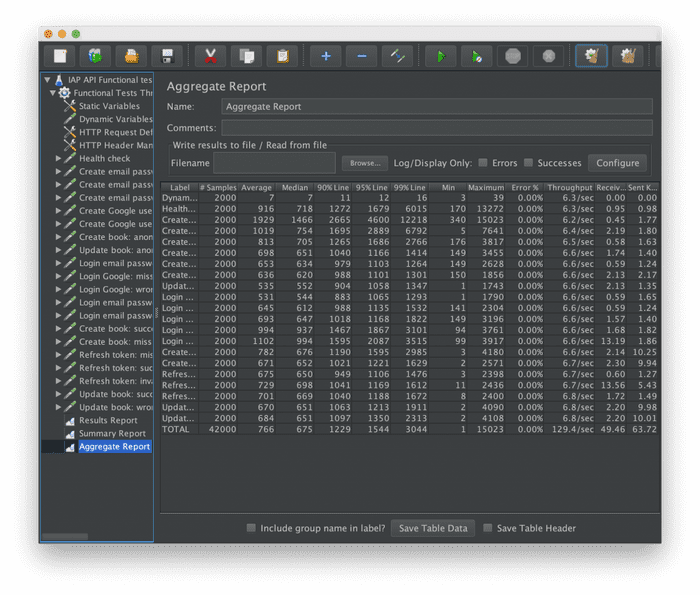
To perform this load test we are going to use JMeter. The following screenshot corresponds to the JMeter project for the example Spring Boot application:
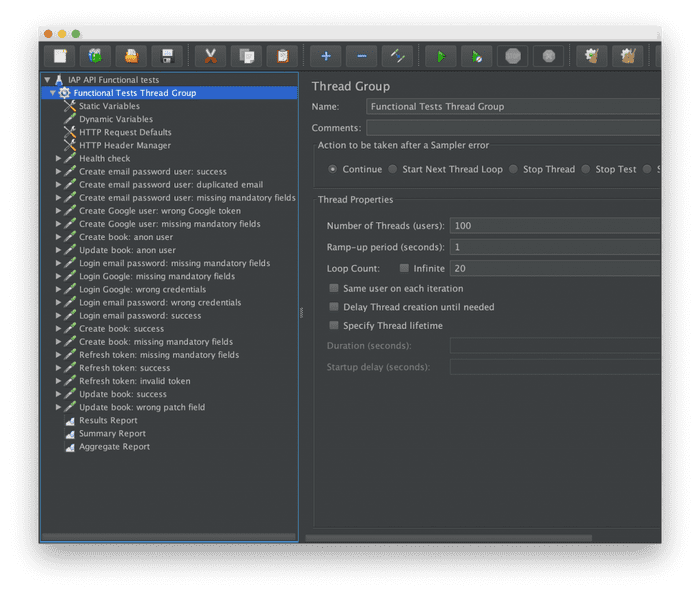
On the left side we find the different functional tests for the Spring Boot application. Each test executes different operations and expects them to be successful.
On the right side we find a section to configure a load test, where among the available options we can configure a number of threads (users) and a loop count, which is equivalent to the number of times that each user, individually, requests each operation.
Based on the forecast above, we set 100 users, and to replicate continued use, we set a loop count of 20.
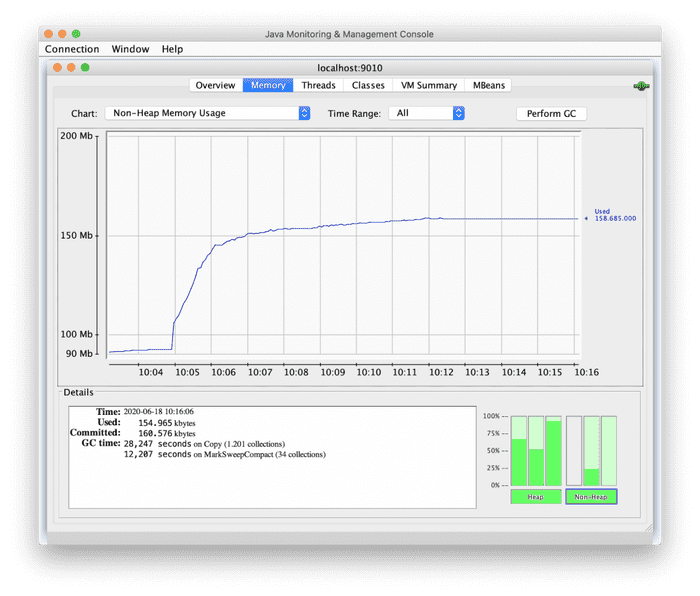
Once the load test is executed, we can see how the graphs in JConsole change:
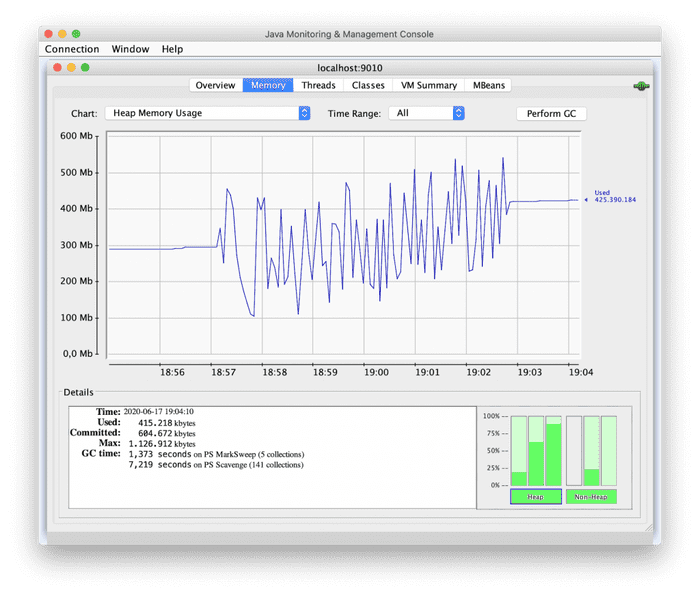
Heap Memory consumption reaches 550Mb during the load test and suddenly increases and decreases in short periods of time, due to the action of the Garbage Collector. When the test ends, memory consumption begins to stabilize again.
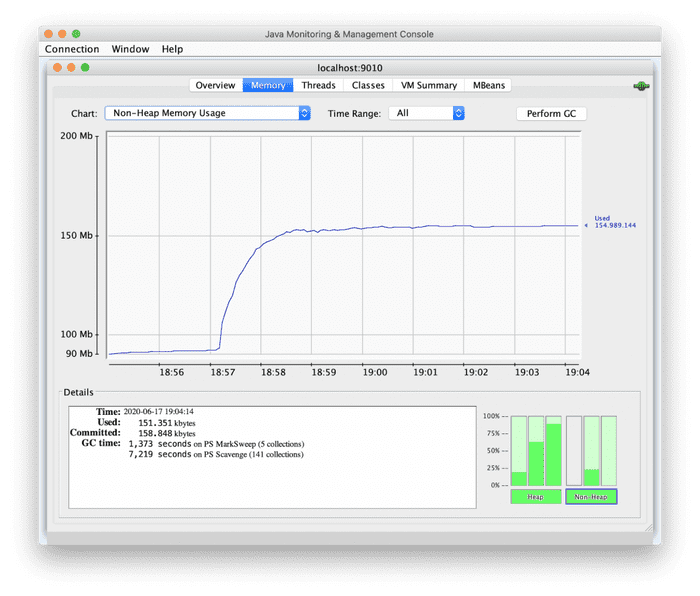
Non-Heap Memory increases and stabilizes at around 158Mb, remaining stable in this range.
Finally we can see the JMeter report with the results of the load test, where we can see the operations throughput and error rate, among other available data.
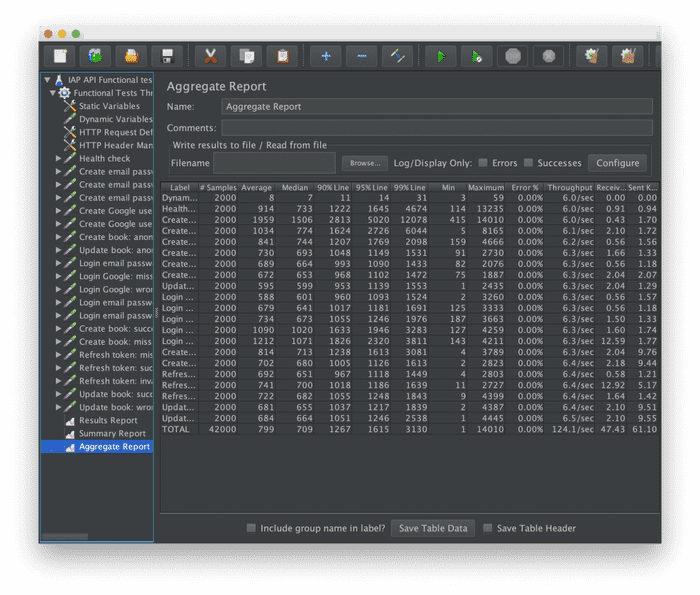
The error rate is 0.00% on all operations and the throughputs sum is 124.1 operations/second.
Taking these values into account is essential to understand the performance of our starting point and to be able to compare it with the performance after performing optimizations.
Optimizing the memory consumption of the application
Heap Memory consumption is directly related to the maximum available (1.2Gb), since the Garbage Collector activates taking this maximum into account. The higher the maximum, the longer the Garbage Collector cycles, making cleanings less common and therefore increasing Heap Memory consumption. This can negatively impact the performance of the application.
For our example, having a maximum of 1.2Gb of Heap Memory and a peak of 550Mb during the load test, we can say that Heap Memory is oversized, which implies longer Garbage Collector cycles. Therefore, the fact that Heap Memory has risen to 550Mb does not mean that the process requires that memory.
On the other hand, looking at the previous Heap Memory graph, we can see how the Garbage Collector acts several times, lowering the memory consumption to about 100Mb, a value that is far below the initial Heap Memory established by default. This is an indicator that the process does not require as much initial Heap Memory.
My approach was to gradually reduce the maximum Heap Memory size, looking for memory consumption values during the load test close to the limit and without penalizing the performance and success of the tests.
It is very important not to adjust the maximum Heap Memory too much. A good approach is to leave room for extreme load spikes that can occur. Given the results obtained in this example, it would be interesting to repeat the load test for a maximum Heap Memory of 512Mb and analyze the results again.
With the new maximum of 512Mb, the initial Heap Memory, set by default to 25% of the maximum, would be 128Mb. In the Heap Memory graph above, we saw how the Garbage Collector sometimes reduces the memory consumption to about 100Mb. This means that the application does not need more than 100Mb to run when there is no load, so 128Mb for the initial Heap Memory is more than enough for a first optimization.
The initial Heap Memory can also be configured through the -Xms flag, although I have preferred to avoid this practice, since it is recommended to keep it at 25-30% of the maximum Heap Memory.
Taking into account the maximum Heap Memory established and the Non-Heap Memory, which in this example reaches about 158Mb, the memory limit of the Docker container can be stablished. It is important not to limit the memory considering only what is required by the Java process, since we must leave some space for the container necessary resources.
After some iterations on the example case, reducing the Heap Memory maximum and analyzing results, I ended up setting the maximum at 256Mb. Taking into account the 158Mb that Non-Heap Memory takes and keeping a small margin of 98Mb, I established a limit of 512Mb for the container.
version: '2.2'

services:

  springboot_app:
    container_name: 'springboot_app'
    image: 'springboot_app:1.0'
    mem_limit: 512m
    environment:
      JAVA_OPTS: '-Dcom.sun.management.jmxremote
                  -Dcom.sun.management.jmxremote.local.only=false
                  -Dcom.sun.management.jmxremote.authenticate=false
                  -Dcom.sun.management.jmxremote.port=9010
                  -Dcom.sun.management.jmxremote.rmi.port=9010
                  -Djava.rmi.server.hostname=0.0.0.0
                  -Dcom.sun.management.jmxremote.ssl=false
                  -Xmx256m'
    ports:
      - '8080:8080'
      - '9010:9010'
    restart: always
Running the load test on the new container, the following results are obtained:
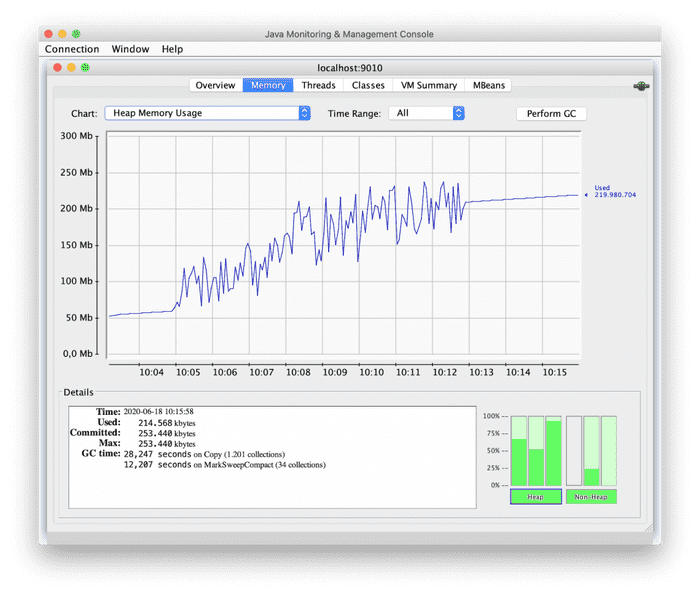
Heap Memory consumption reaches peaks close to the maximum, although the prudential margin is maintained. We can see how the Garbage Collector acts more regularly to keep memory consumption below the maximum.
Non-Heap Memory consumption remains exactly the same. This makes sense as no optimization has been performed on this part of memory.
The results of the load test are very positive, as the application continues to respond with an error rate of 0.00% maintaining the same throughput.
If we need the container size to be more reduced, we can limit the size of Heap Memory even more. In this example I haven’t reduced the limit to less than 256Mb, since in that case I encountered errors during the load test due to lack of memory.
A next optimization can be to reduce the memory consumption of Non-Heap Memory components.
Conclusion
In this post I have shared with you a possible approach to optimize the memory consumption of a dockerized Java application.
The first step has been to understand the memory consumption of a Java process. Then we have monitored the process to analyze its memory consumption. Finally, based on our analysis, we have established memory limits for both the process and the Docker container.
By following these steps we can obtain a great saving of resources, which directly affects the size of the infrastructure necessary to deploy the containers and thus reduce costs.
I’m sure that there are other ways to carry out this type of optimizations, so feel free to share your experiences with me.
I will also be happy to answer any questions you may have!